|
|
|
|
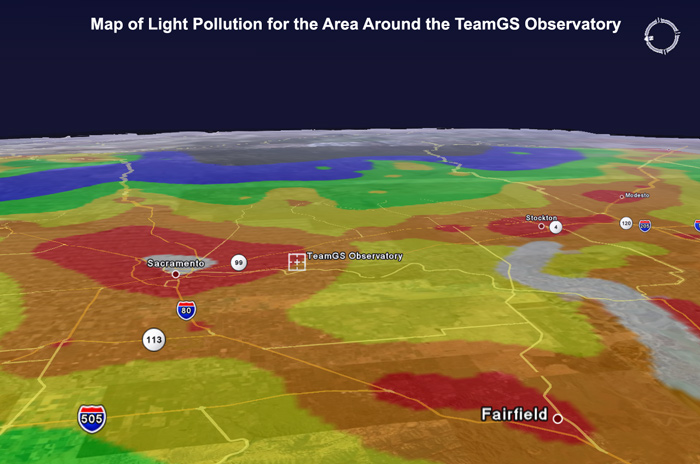
Colors correspond to ratios between the artificial sky
brightness and the natural sky brightness of: <0.01 (black), 0.01-0.11 (dark-gray), 0.11-0.33 (blue), 0.33-1 (green), 1-3 (yellow), 3-9 (orange), 9-27 (red), <27 (white).
As you can see, my home is located in a bad area of light pollution, and it is only getting worse. There has been an explosion of stores, gas stations, parking lots, homes with street lights, etc. all within a mile of my house. In the 4 years that I have been imaging, I have seen a very noticeable increase in the light pollution in my area. I have a very difficult time now imaging anywhere other than the zenith, and on brighter objects. I am now starting to do more narrowband imaging, as it cuts through the pollution fairly well. If I had the time, I would like to go to a dark site to image, but with my family obligations and work, it is not very likely.
Images courtesy of Google Earth and The Royal Astronomical Society Light Pollution measurements Credit: P. Cinzano, F. Falchi (University of Padova), C. D. Elvidge (NOAA National Geophysical Data Center, Boulder). Copyright Royal Astronomical Society. Reproduced from the Monthly Notices of the RAS by permission of Blackwell Science. www.lightpollution.it/dmsp/ |
|